Programming
Debugging the Hard Way
For those of you who are terminal fanatics, and love running their code from the command line, debugging can sometimes be a pain. Often my debugging workflow would have been (when not working in PyCharm), reading the error, finding the file and line number, opening the respective script and adding a pdb.set_trace statement, and then rerunning the script.
This long process doesn’t just take up some precious time, but it interrupts your mental flow. So maybe there’s a better way…
Post Mortem Debugging
This stackoverflow discussion gives a great solution to our problem. All you have to do is run your problematic script in the following way:
python -m pdb -c continue error.py
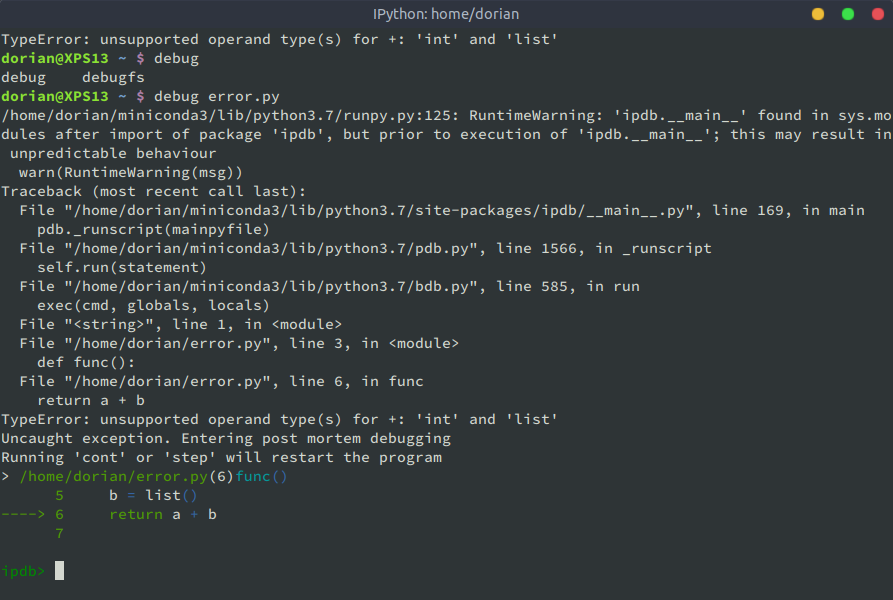
This will run the error.py script, and if any errors are encountered it stops and launches an interactive python shell at the moment where the error happens.
Here’s an example of the output:
Traceback (most recent call last):
  File "/home/dorian/miniconda3/lib/python3.7/pdb.py", line 1697, in main
    pdb._runscript(mainpyfile)
  File "/home/dorian/miniconda3/lib/python3.7/pdb.py", line 1566, in _runscript
    self.run(statement)
  File "/home/dorian/miniconda3/lib/python3.7/bdb.py", line 585, in run
    exec(cmd, globals, locals)
  File "<string>", line 1, in <module>
  File "/home/dorian/error.py", line 3, in <module>
    def throw_error():
  File "/home/dorian/error.py", line 5, in throw_error
    1 + my_list
TypeError: unsupported operand type(s) for +: 'int' and 'list'
Uncaught exception. Entering post mortem debugging
Running 'cont' or 'step' will restart the program
> /home/dorian/error.py(5)throw_error()
-> 1 + my_list
(Pdb)
This is great! Although we still have to rerun the script, we no longer need to dive into the code and set our breakpoints with pdb.set_trace.
Less typing with bash aliases
Although using this saves some steps, we still need to remember this pretty verbose command. If you aren’t already familiar with bash aliases, this is as good a time as any to start using them.
All you need to do is add the following line to either your ~/.bashrc or ~/.bash_aliases file:
alias pydebug="python -m pdb -c continue"
Now instead of typing that whole string of commands, we can just call pydebug error.py and we get the same debugging magic.
Remember that you need to reload your .bashrc file before your aliases work. Just run source .bashrc and you’re ready to go
Adding some functionality to pdb
Most of you probably don’t work in the basic python shell too much, and I personally am pretty hopeless without intelligent code completion. If you want all these wonderful things in this debugging shell, you’re in luck! You just need to replace pdb with ipdb and you get an IPython shell instead of the basic python one. Although pdb is included with python itself, ipdb needs to be pip installed.